What each section does, and how to use it well
From importing your scale to downloading the SPSS file, screen by screen, with tips. Screenshots come from a sample survey; the figures are sample data.
One study, five steps
- 01ImportImport tab: Word, PDF, photo or pasted text
- 02EditSurvey editor and Mobile preview
- 03ShareStart collecting responses, send the link
- 04CheckResponses page and quality report
- 05AnalyzeAnalysis, downloads and method paragraph
In a pre/post test study, step three adds the Training · Pre/Post test tab: pretest, video, posttest.
Where everything starts
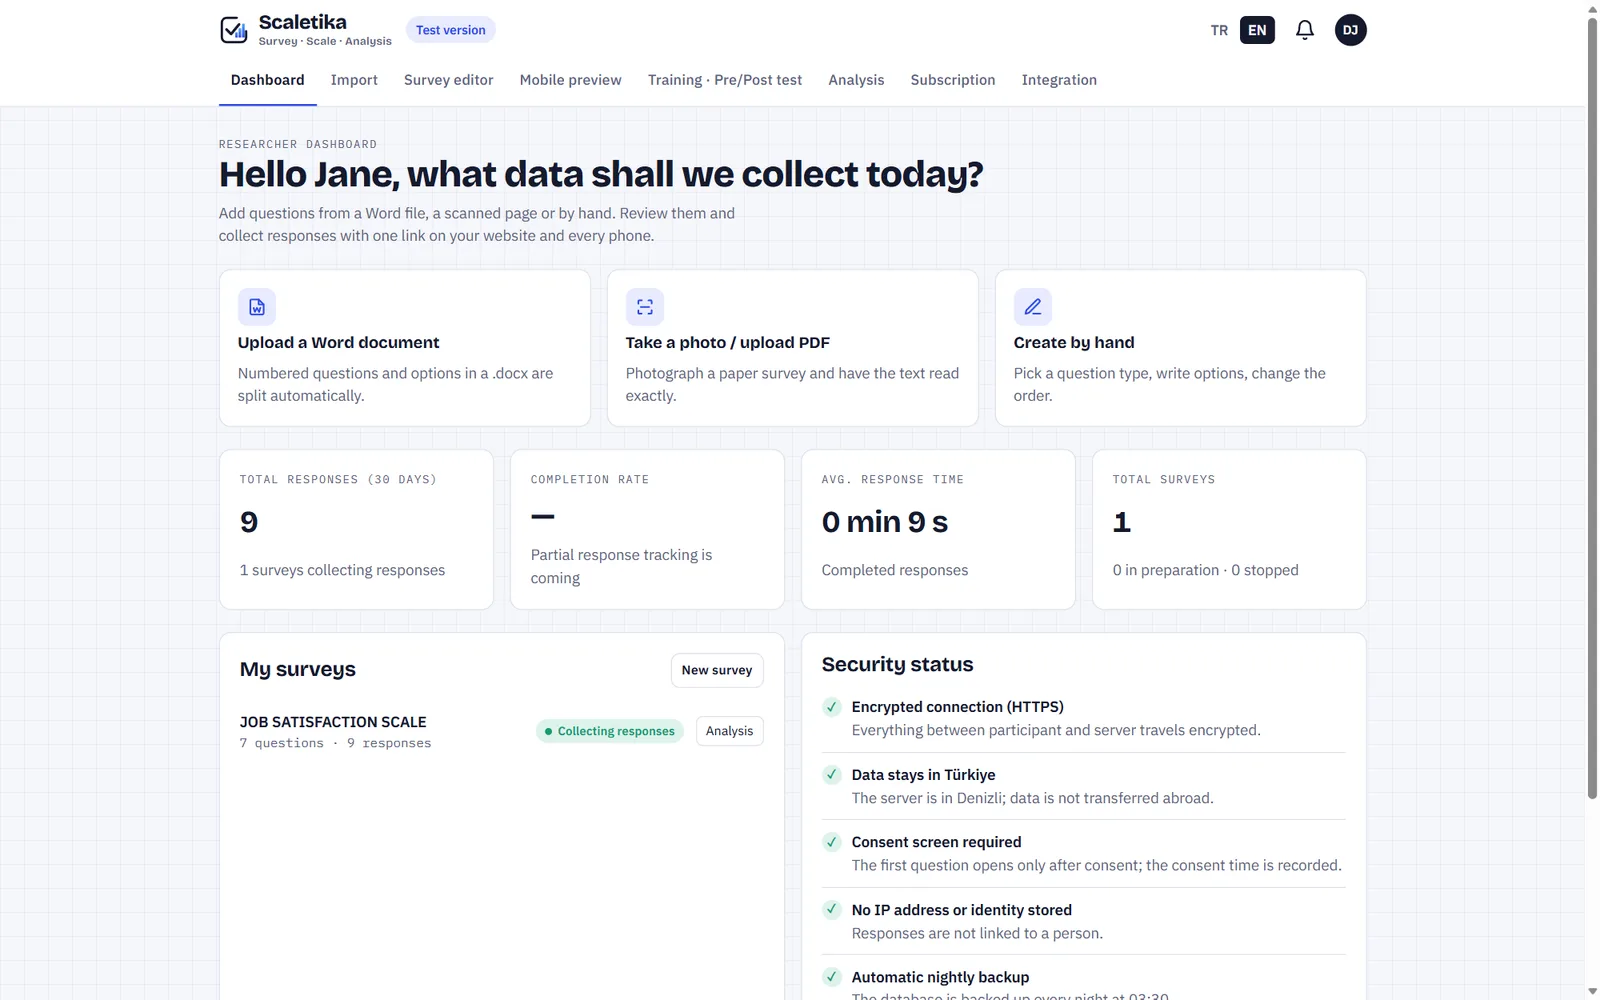
All your surveys, responses from the last 30 days and the completion rate at a glance. New surveys start here.
Using it well
- Pick one of the three cards at the top: Word, photo/PDF or by hand.
- A low completion rate often means the survey is too long.
- Each survey shows its status: In preparation, Collecting responses, Stopped.
Don’t retype your scale
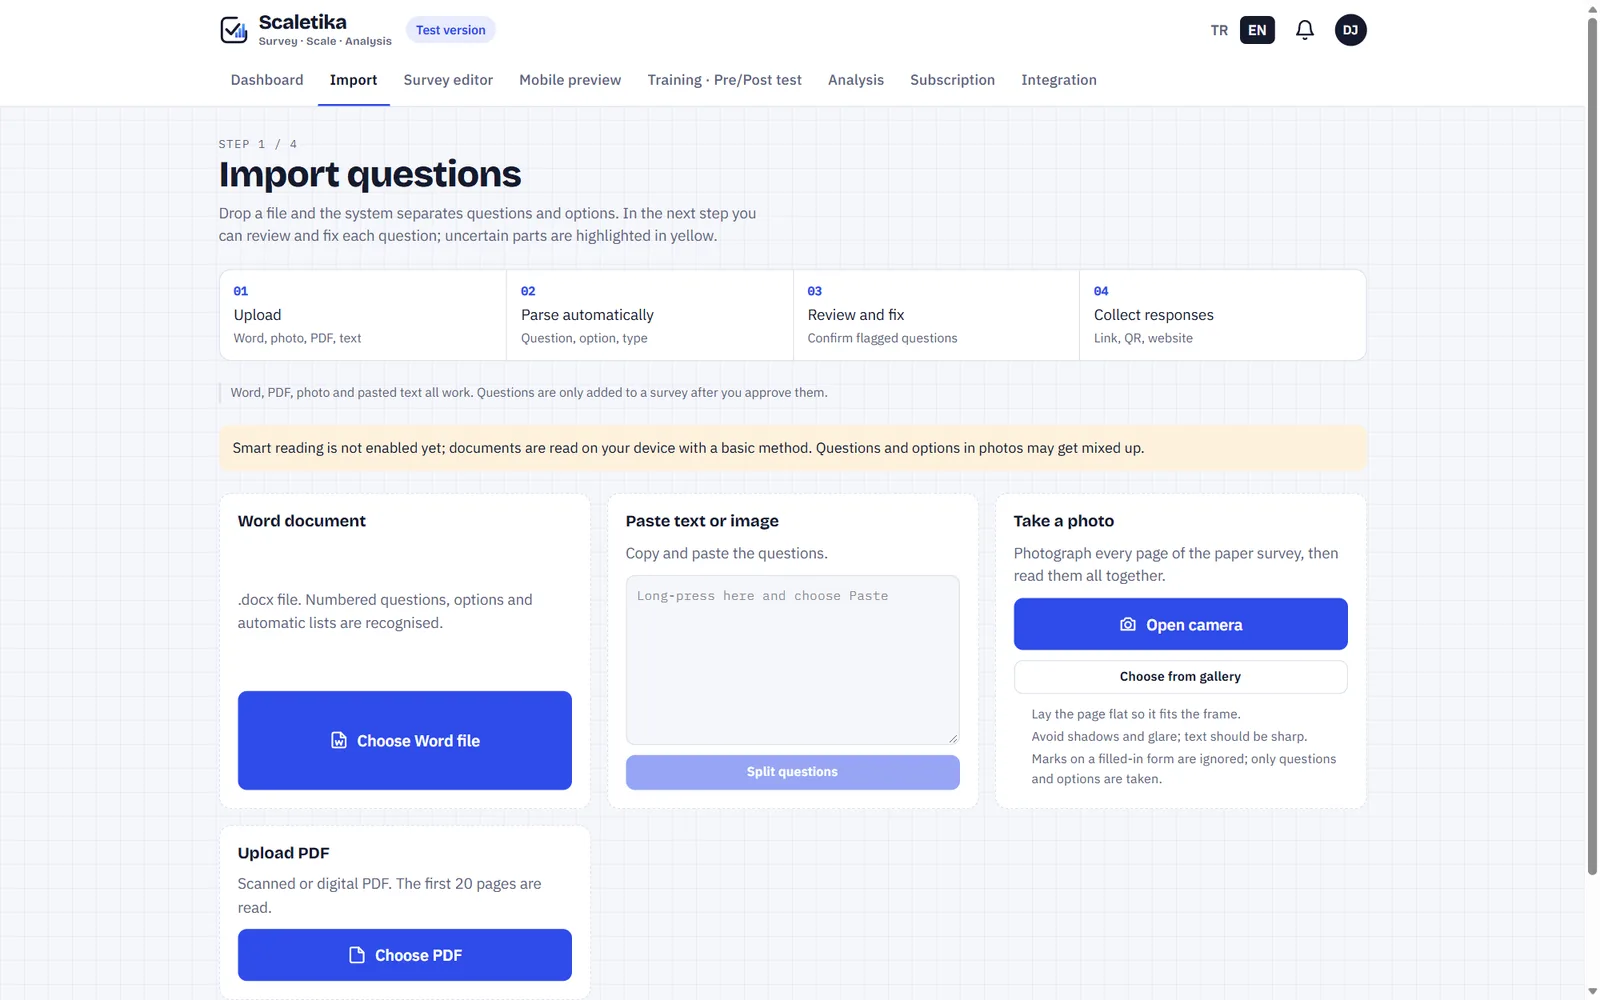
Word, PDF, a photo of the paper or pasted text: questions and options are split and sent to the editor. Nothing is added to the survey until you approve it.
Using it well
- For photos, lay the page flat, fit it all in the frame and avoid shadows.
- Questions numbered “1.” or “1)” split more accurately.
- Smart reading counts as pages per month, depending on your plan.
- You can choose up to 5 Word or PDF files at once; each file becomes a separate draft survey.
Check it card by card
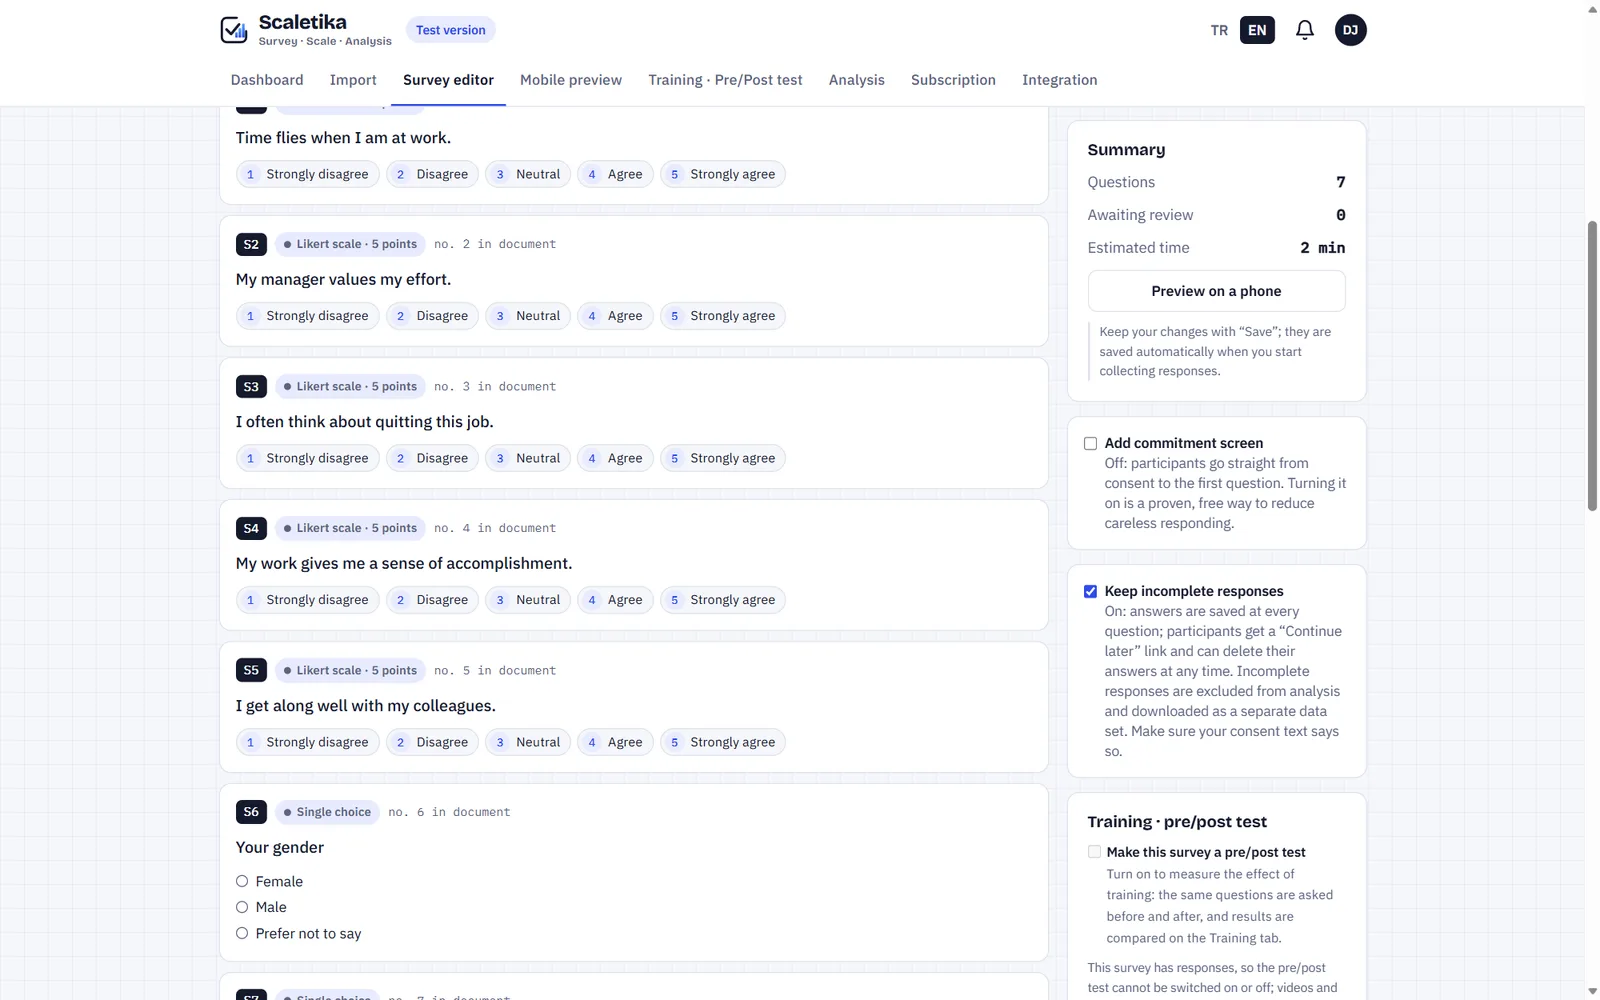
Each question is a card. The Summary on the right shows the question count, items to review and estimated time.
Using it well
- Compare yellow cards with your document, then confirm.
- Set the Likert points once and apply them to all items.
- Add an “Attention check item” to catch careless answers.
- For an experiment without a pre-test or a comparison of two existing groups, turn on “Compare two groups”; use separate links or a random allocation list.
- For expert review, open the “Expert review” box in the editor: choose the Davis or Lawshe method and send experts personal links; content validity values and the methods paragraph are prepared.
- If you notice a mistake, you can correct it while collecting responses; if you are changing a question or its options, “Copy this survey” is safer.
- If you prepared a demographic form and scales separately, use “Combine surveys” to put them one after another in a single survey; each appears under its own section and scale scores are calculated separately.
Turn items into a scale
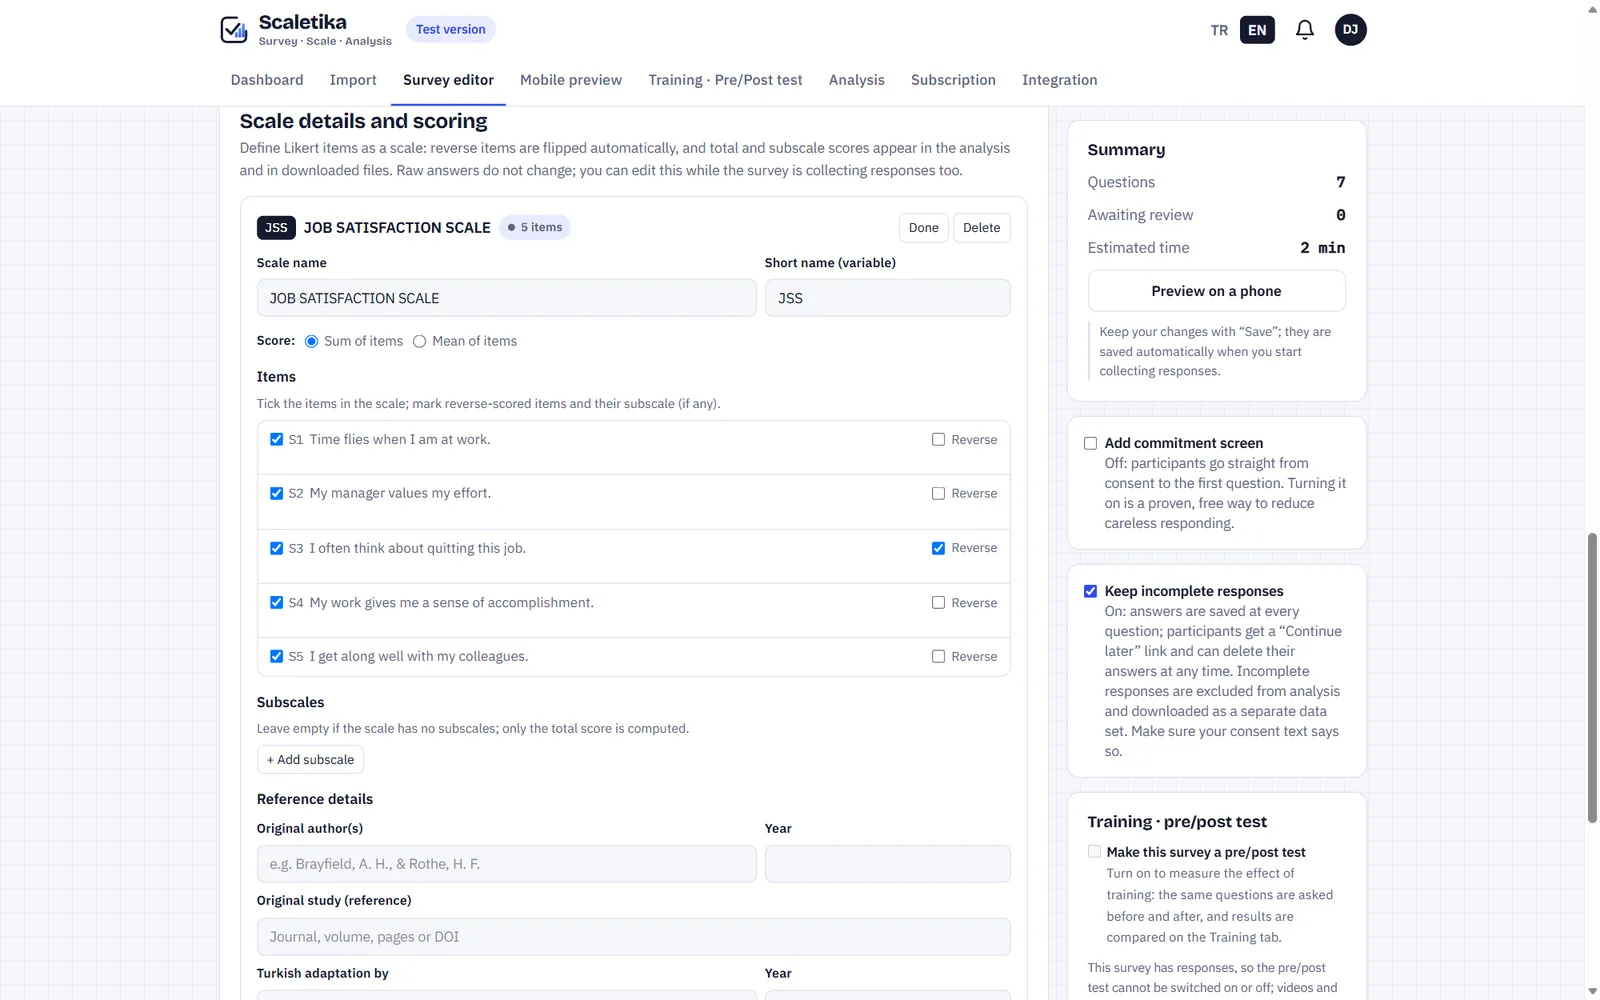
In Scale details, reverse items are flipped for you and total and subscale scores are calculated. The citation and APA reference go into the method paragraph.
Using it well
- Tick “Reverse” on reverse-scored items, or reliability comes out wrong.
- Commitment screen and partial responses are on the right panel.
- Turn on “Show Likert items together” to show items with the same options on one screen: a grid on computers, numbered buttons on phones.
- To ask a question only after a certain answer (e.g. “If yes, please explain”), use “Ask only after a certain answer” under the question’s Edit. When importing, this link is made automatically and shown for your approval.
- Scale details can be edited while collecting responses too.
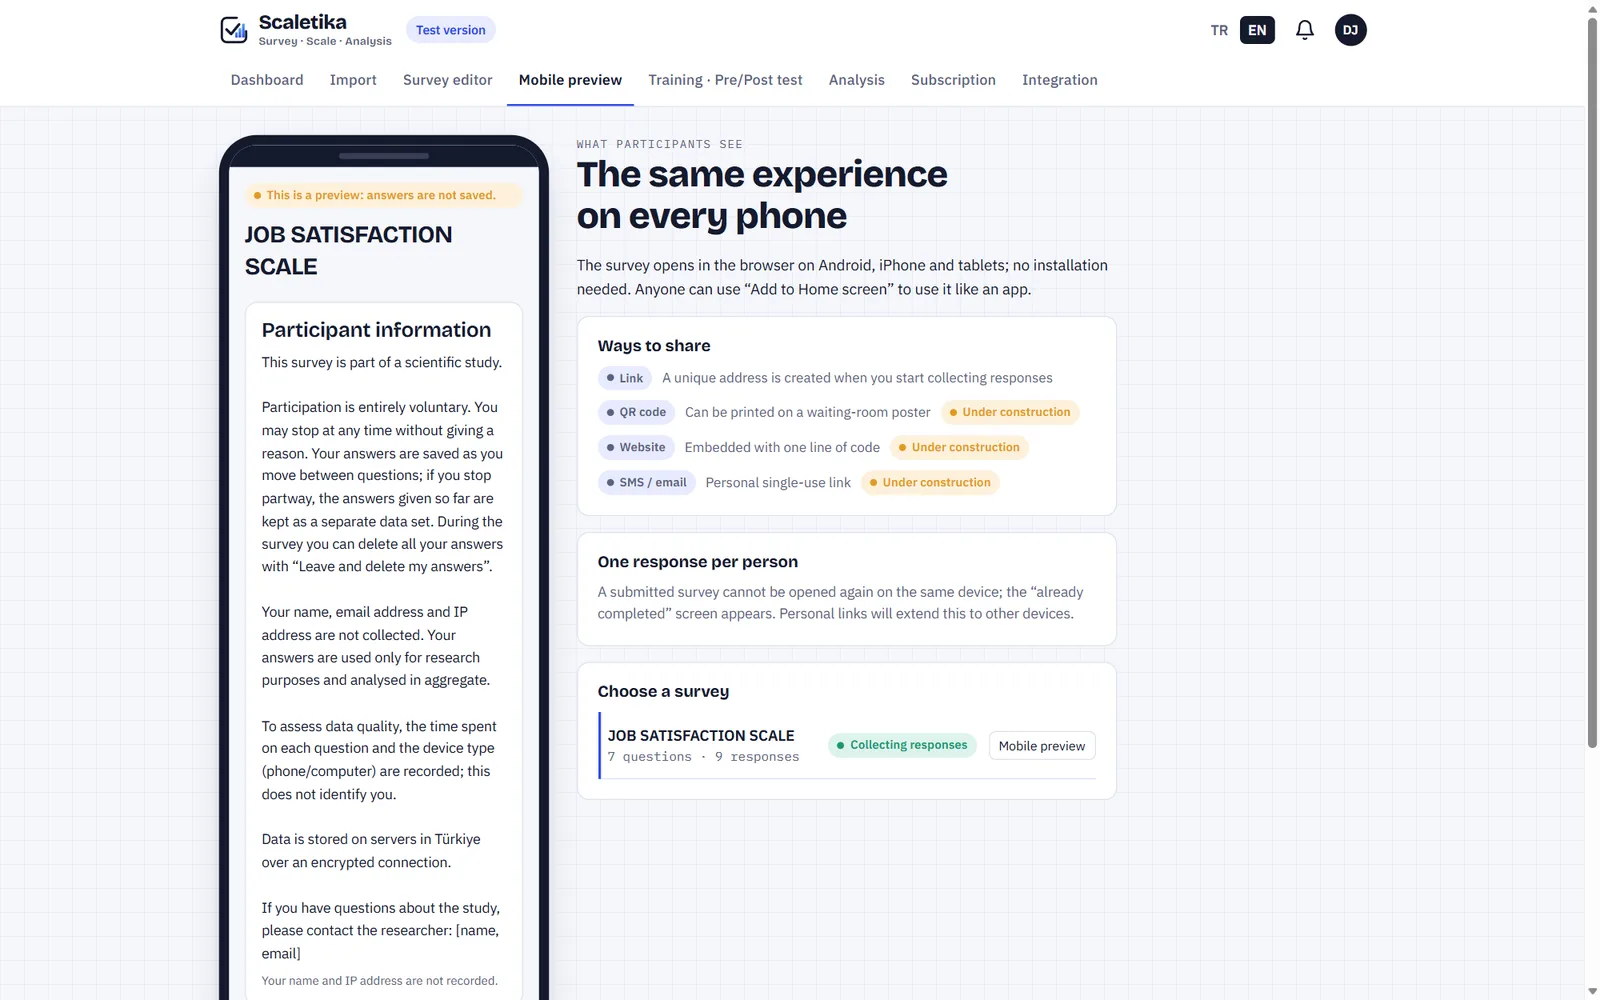
Try it on a phone before you start
Shows exactly what participants will see, without saving anything. You can still make corrections after you start collecting.
Using it well
- Test with the preview, not the real link.
- Read the consent text and question order one last time.
- Ways to share: link, QR code, website, SMS or email.
Start collecting responses
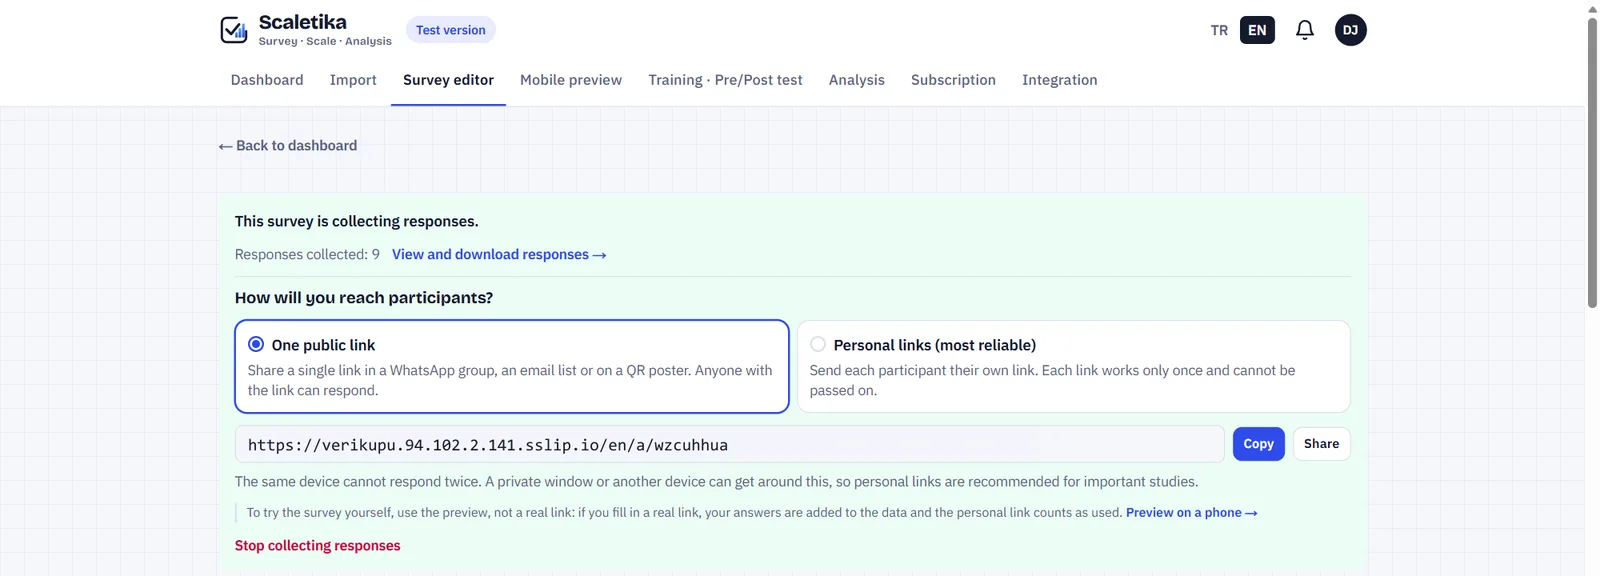
After “Checked — start collecting responses” your survey gets its own address. It opens only through that link; no one else can see it.
Using it well
- One public link: WhatsApp group, mailing list, QR poster.
- Personal links: single use, one per person; the most reliable for important studies.
- When you are done, “Stop collecting responses”.
Consent, one question at a time, thank you
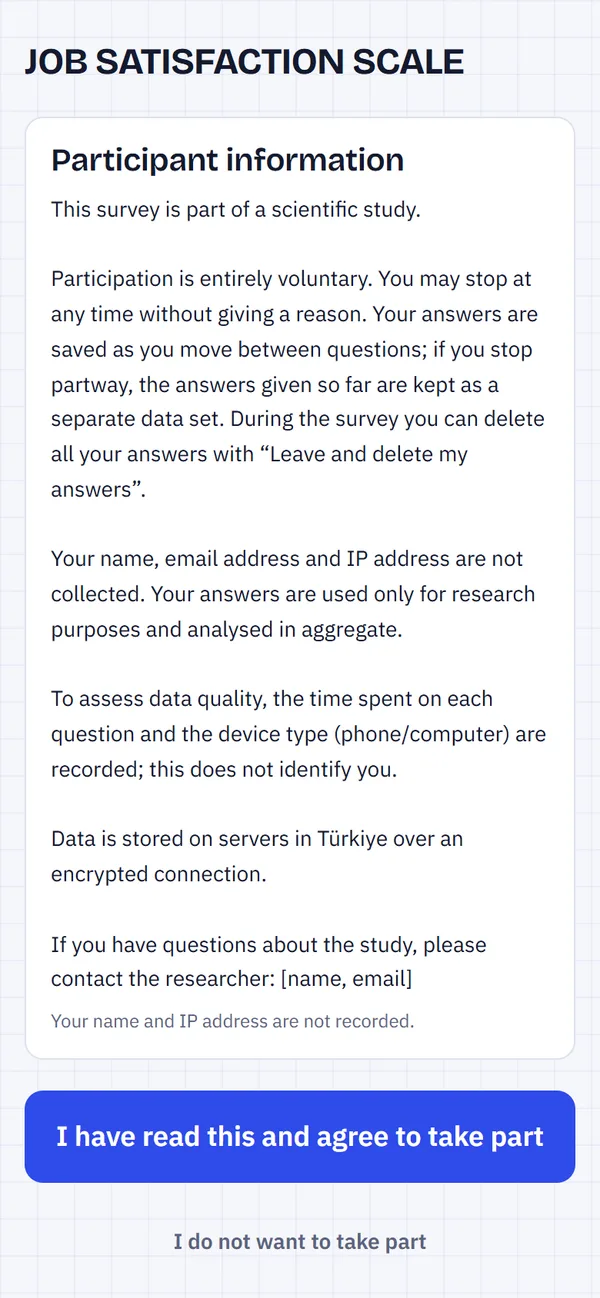
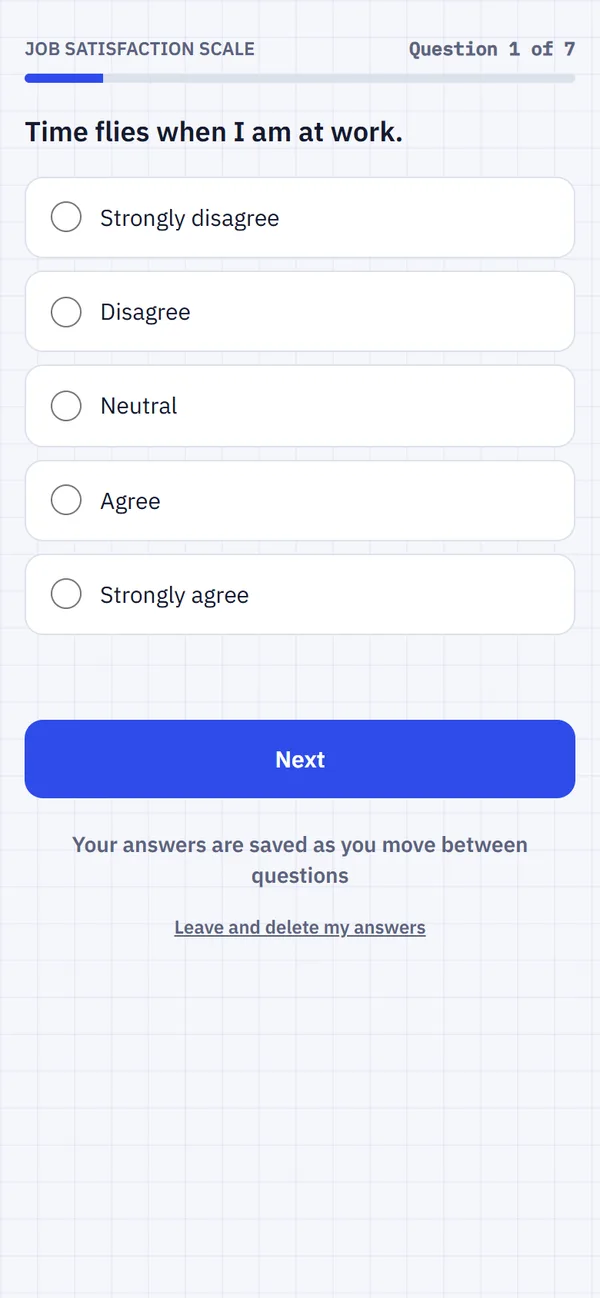
Participants install nothing; they open the link in a browser. The first question stays locked until they consent. Participant screens never show ads.
Using it well
- State the purpose, duration and contact details in the consent text.
- A participant who stops can resume on the same device.
- The same device can’t submit twice.
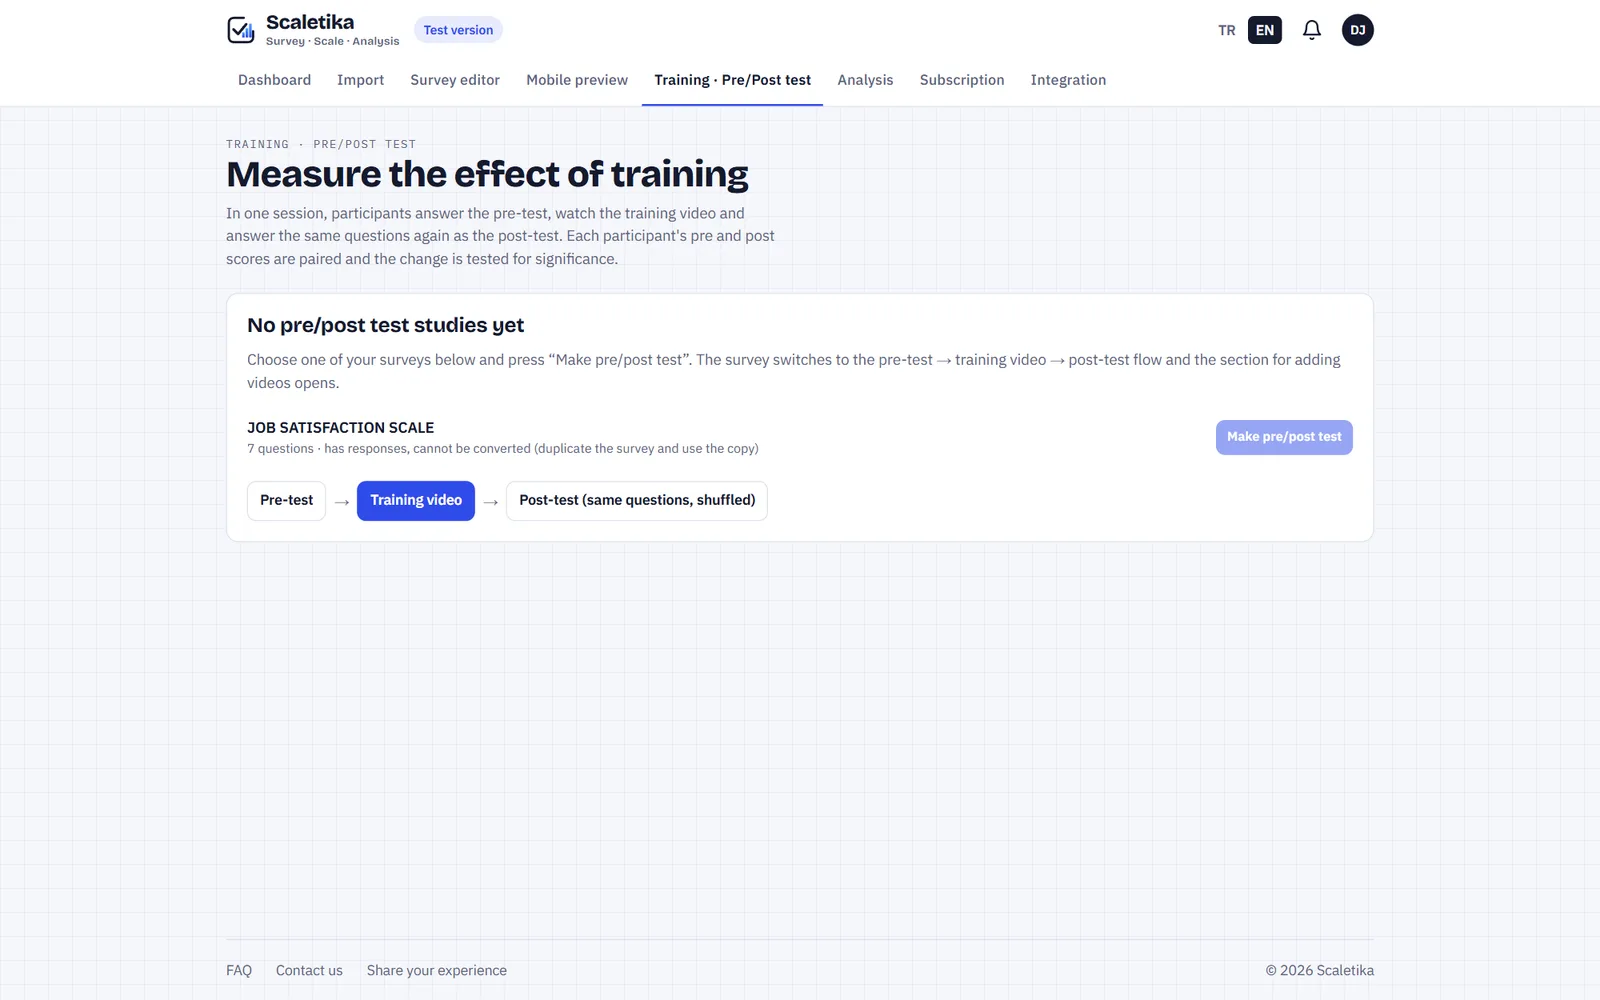
Measure the effect of training
Pretest, training video and posttest in one sitting. Optionally add a retention test, a control group and certificates. Results appear on this tab: paired t, Wilcoxon, ANCOVA.
Using it well
- Turn on pre/post test before any responses arrive.
- Upload the video in the “Training videos” card or add a YouTube link; the posttest stays locked until the video ends.
- Mark the correct answers; the score is the number correct.
- For retention, wait 2–4 weeks and use personal links.
- If you deliver the training outside the app (face to face), choose “Outside the app” in the editor: after the pre-test, you open the post-test from the Training tab.
- Enter the trainer's expertise and the sources of the content in the “Training details” box in the editor; they are added to the methods paragraph and a downloadable summary. These details are your own declaration.
Distributions and reliability
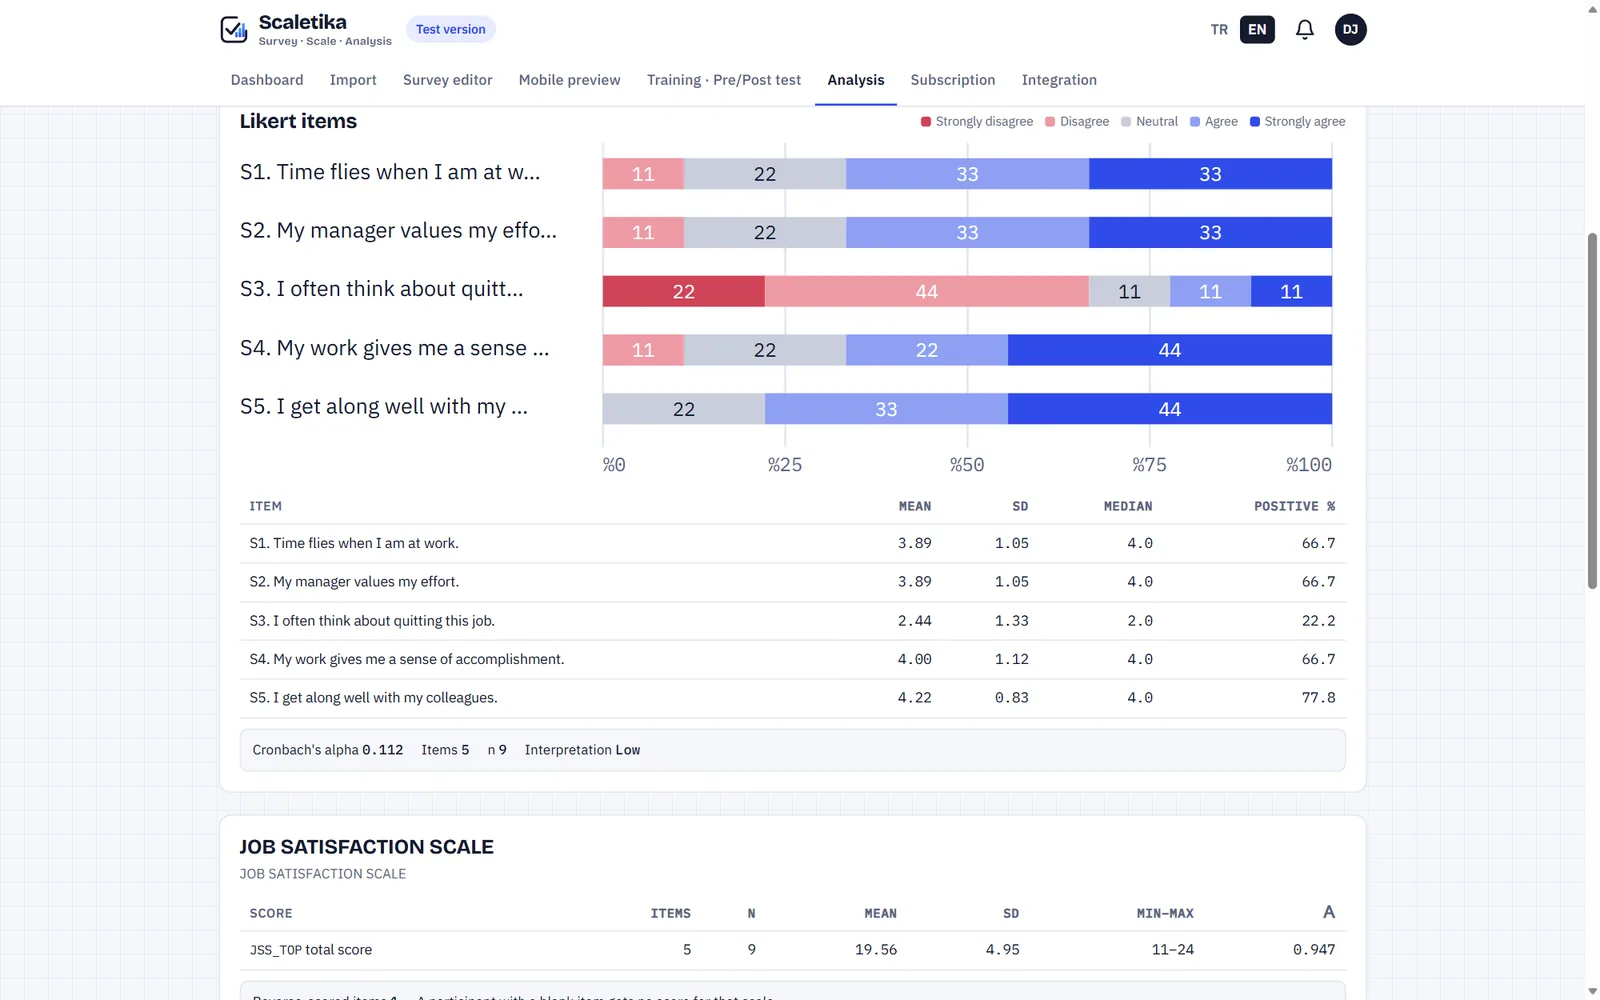
Each Likert item’s distribution with mean, standard deviation, median and Cronbach’s alpha.
Using it well
- Use the filter to look at one subgroup.
- Low alpha? Check reverse items first.
- Figures update as responses come in.
- If you turned on “Compare two groups” in the editor, the Analysis tab compares the groups automatically; downloaded files include a GRUP column.
Analysis assistant
Paste your method section; Scaletika summarizes your plan in plain language, shows what may be missing as notes and runs the comparisons.
Using it well
- Pasting the population-sample and data analysis sections is enough.
- Yellow items are suggestions; you decide.
- You can change the suggested question matches from the list.
Cross-tab and chi-square
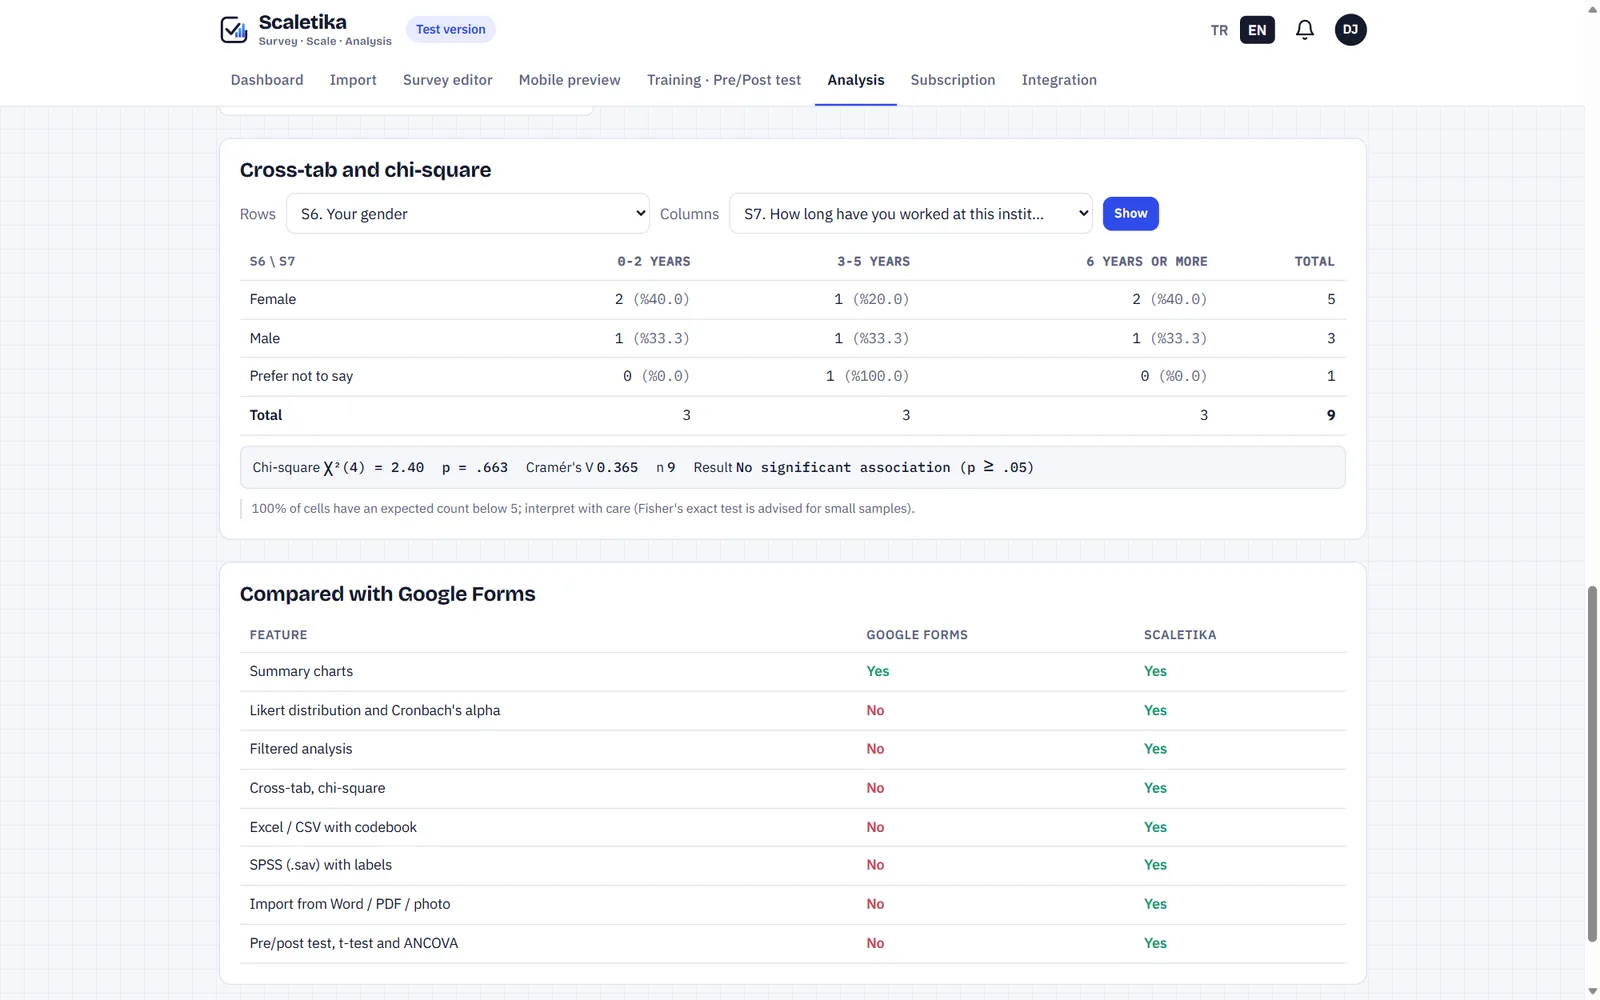
Compare two questions: chi-square, p value and Cramér’s V in one click.
Using it well
- Put the demographic question in rows and the outcome in columns.
- Heed the warning when expected counts fall below 5.
- When p ≥ .05 the result reads “no significant association”.
Compare by any question
Choose any single-choice question as the grouping variable; a scale score, Likert item, number or choice question is compared across groups.
Using it well
- For two groups a t test or Mann-Whitney U is suggested; for three or more, ANOVA or Kruskal-Wallis.
- The reason for the suggestion is written under the table; the other option's result is shown too.
- You can change the normality criterion to match your method.
- Pay attention to the warning shown for small groups.
Every response gets a traffic light
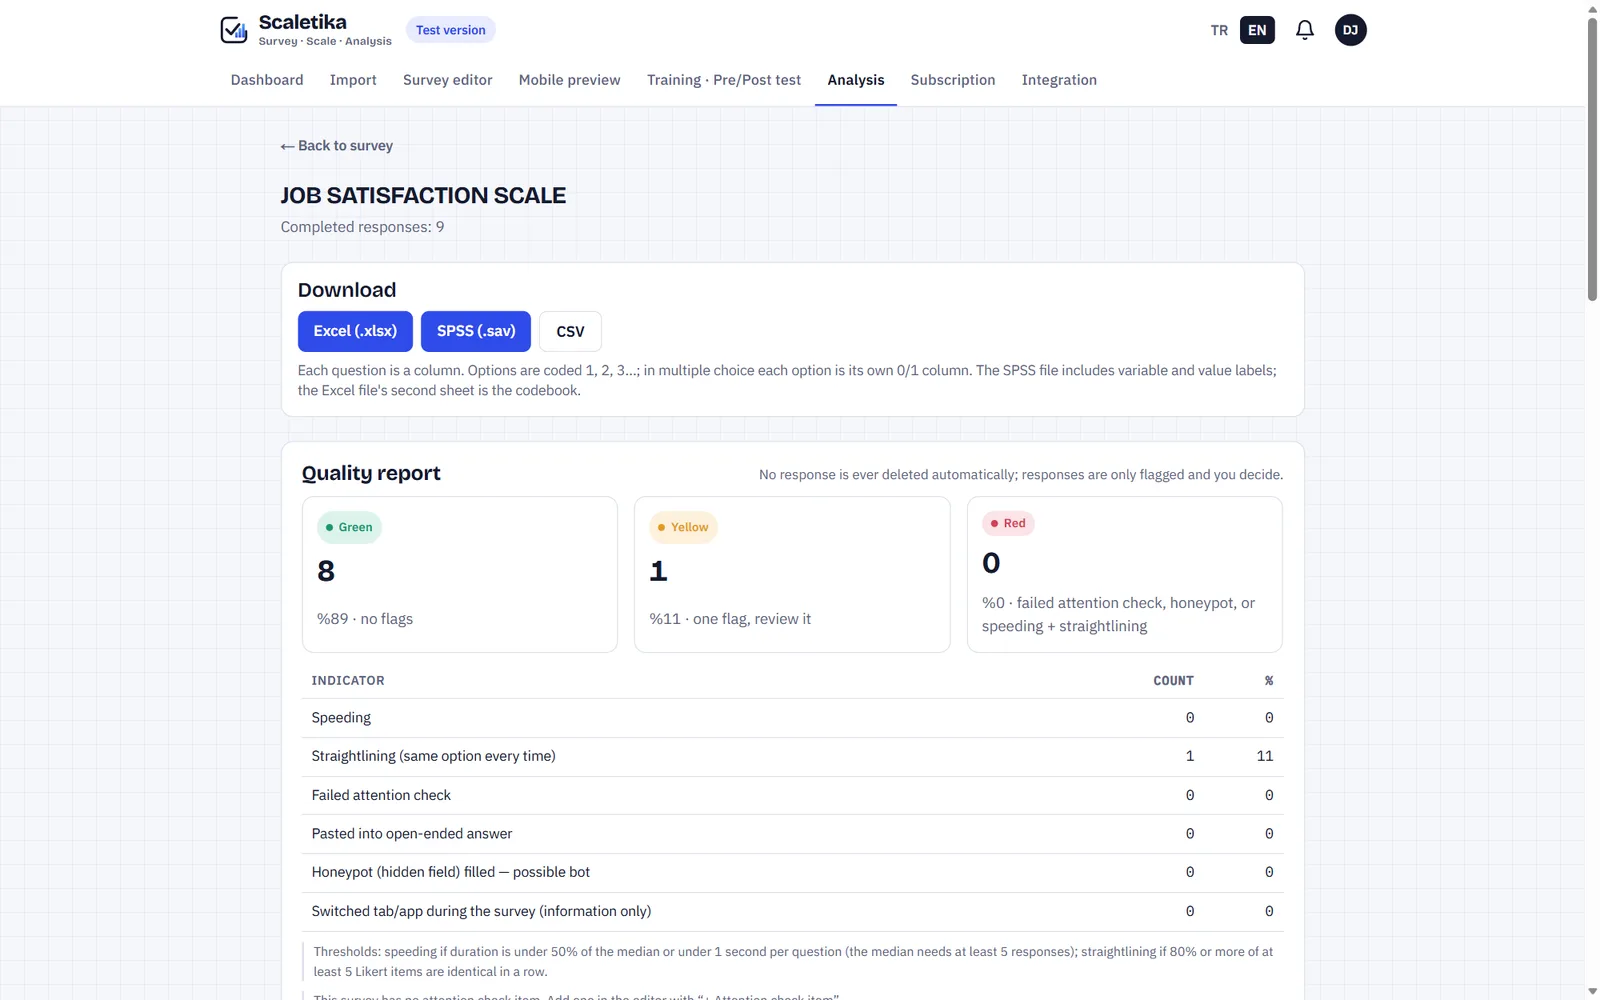
Speeding, straight-lining, failed attention checks, pasting and honeypot traces are flagged. Reach this page from “All question summaries” on Analysis.
Using it well
- Nothing is deleted automatically; you decide.
- Check the reason before removing red ones.
- The raw data table shows each row’s flag.
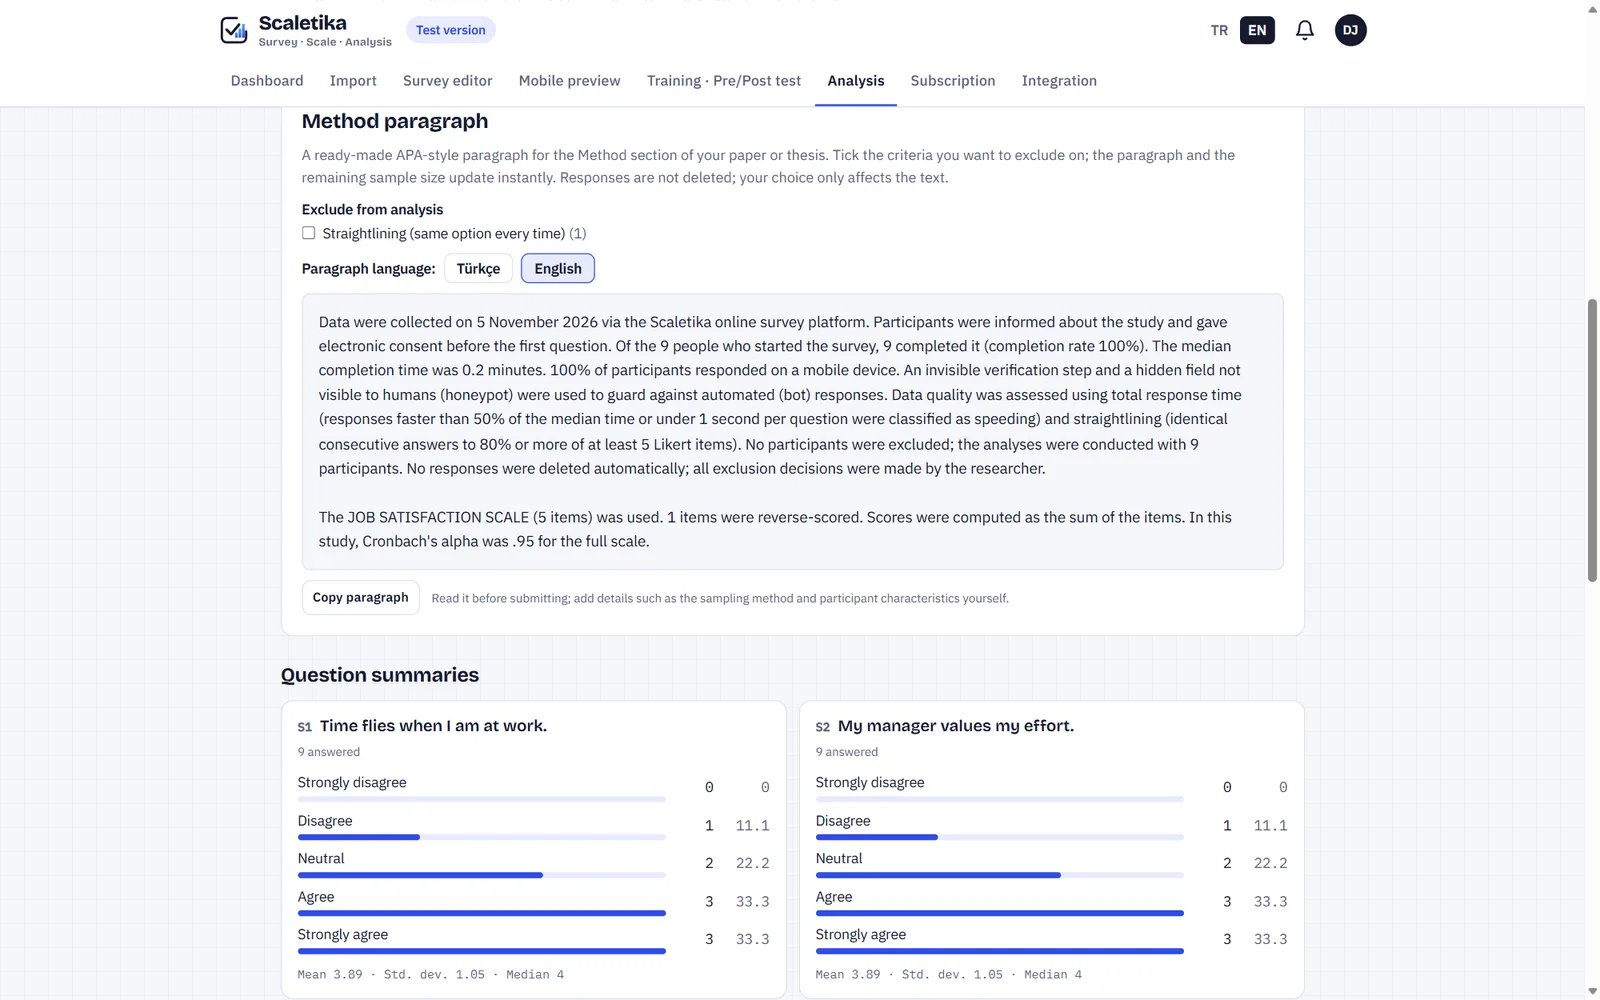
Your method paragraph, ready
An APA-style paragraph that updates when you pick exclusion rules. Data downloads as Excel, SPSS (.sav) or CSV.
Using it well
- Get it in English or Turkish and copy it.
- Add your sampling method and participant details yourself.
- The SPSS file comes with value labels; the Excel file’s second sheet is the codebook.
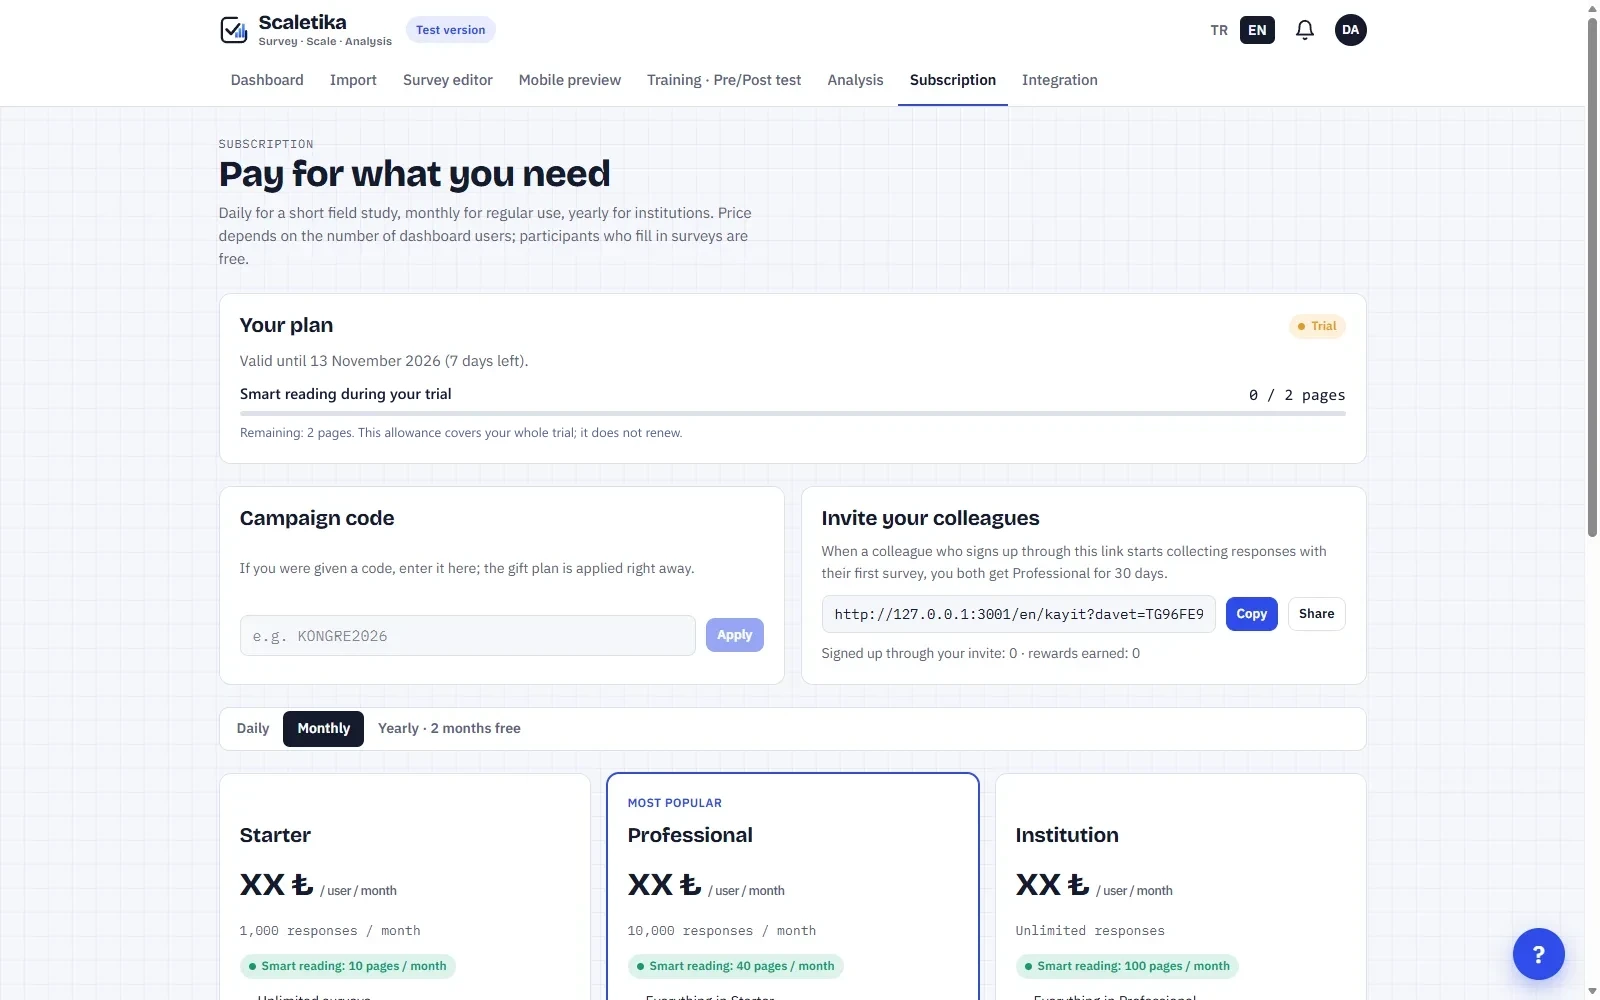
Your plan and allowances
Plan, end date and this month’s smart reading use. Campaign codes and colleague invites live here too. Participants never pay.
Using it well
- New accounts start with a 7-day trial.
- When a colleague you invite starts their first survey, you both get bonus time.
- Daily passes suit short fieldwork.
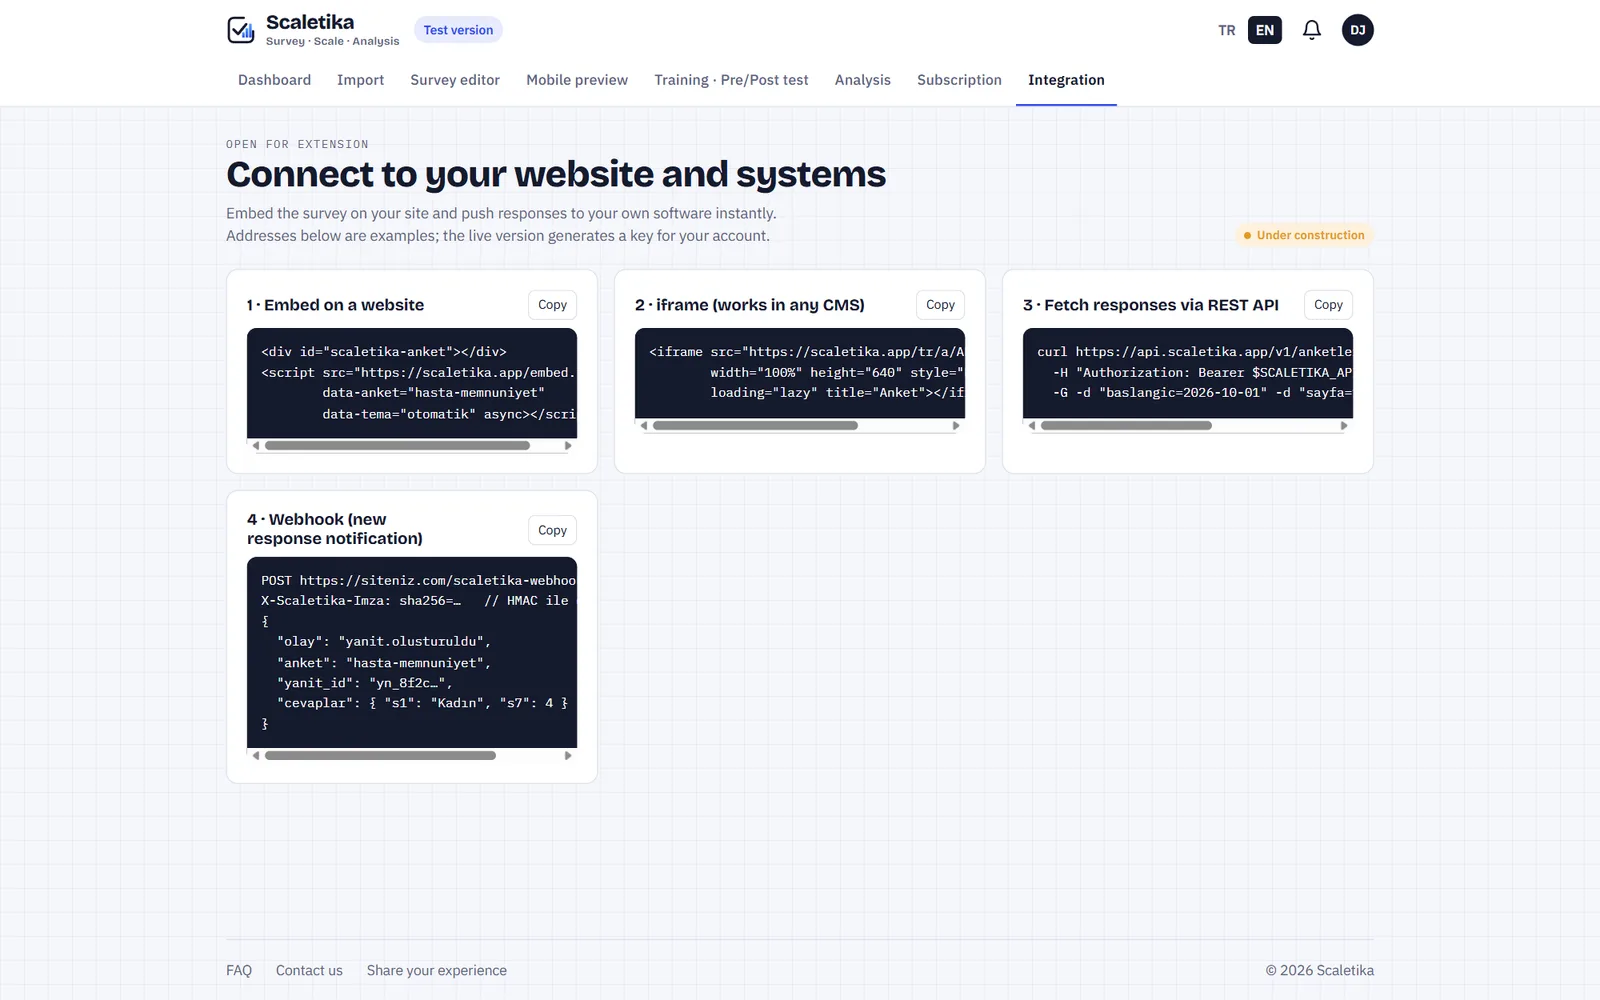
Connect to your website
Examples for embedding the survey, iframe, REST API and new-response notifications (webhook). This section is in preparation: the code is an example, and the live version will issue a key for your account.
Using it well
- For an institutional website, iframe is easiest.
- Work with your technical team on API and webhooks.
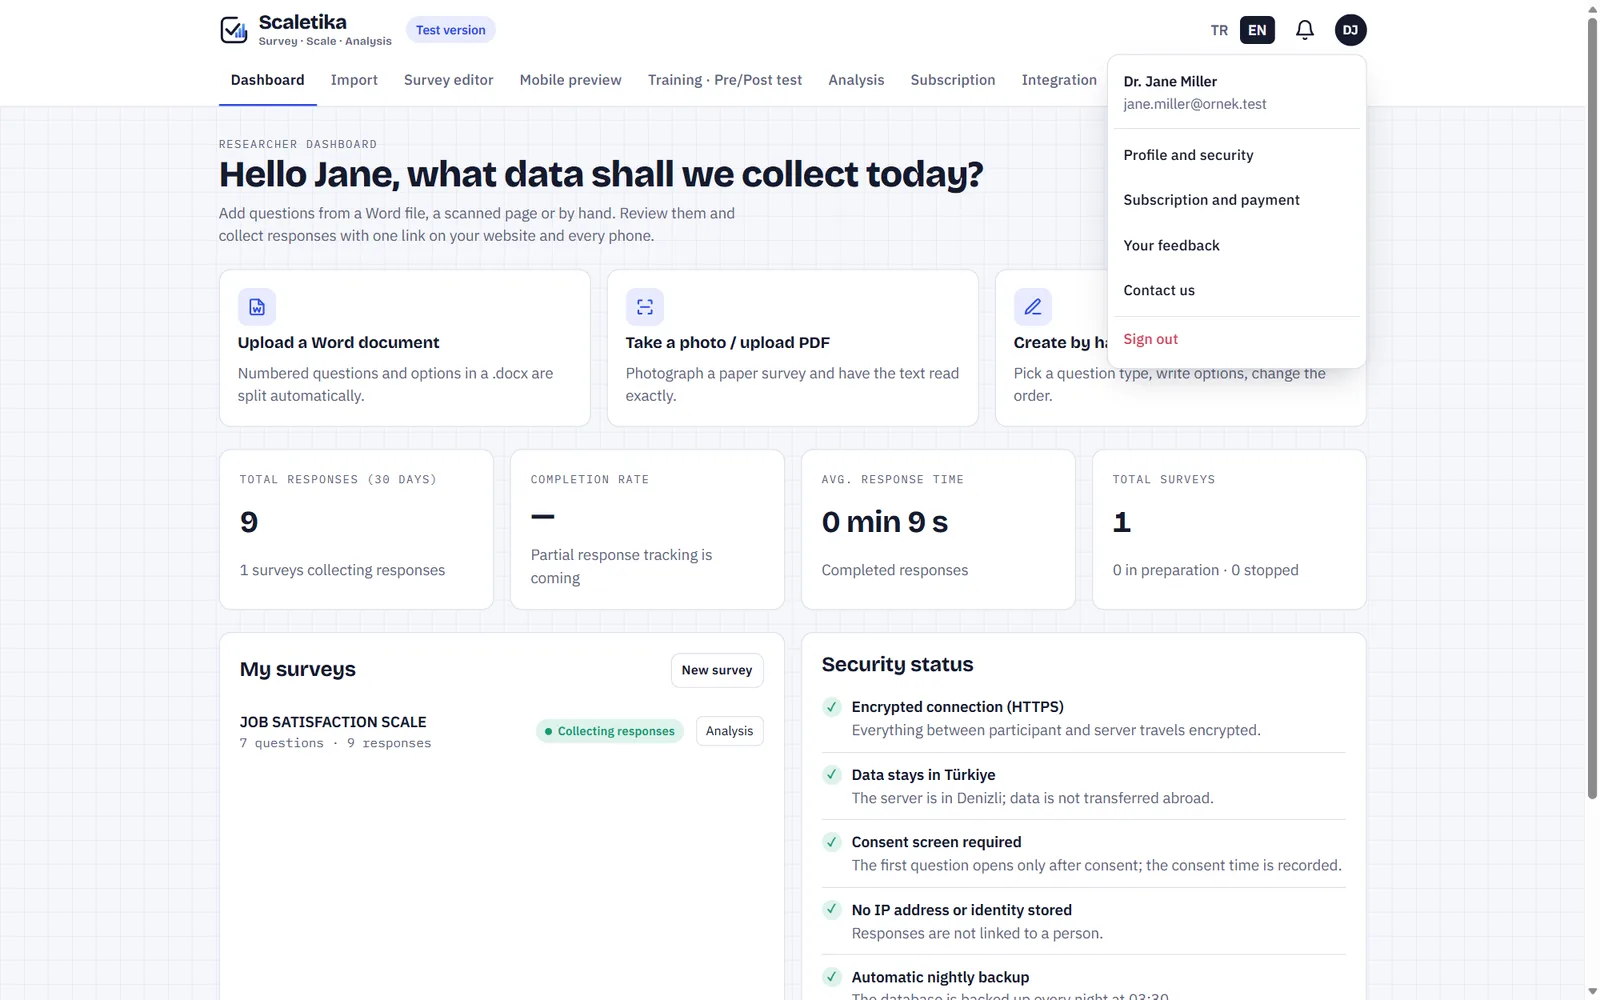
Help at the bottom of every screen
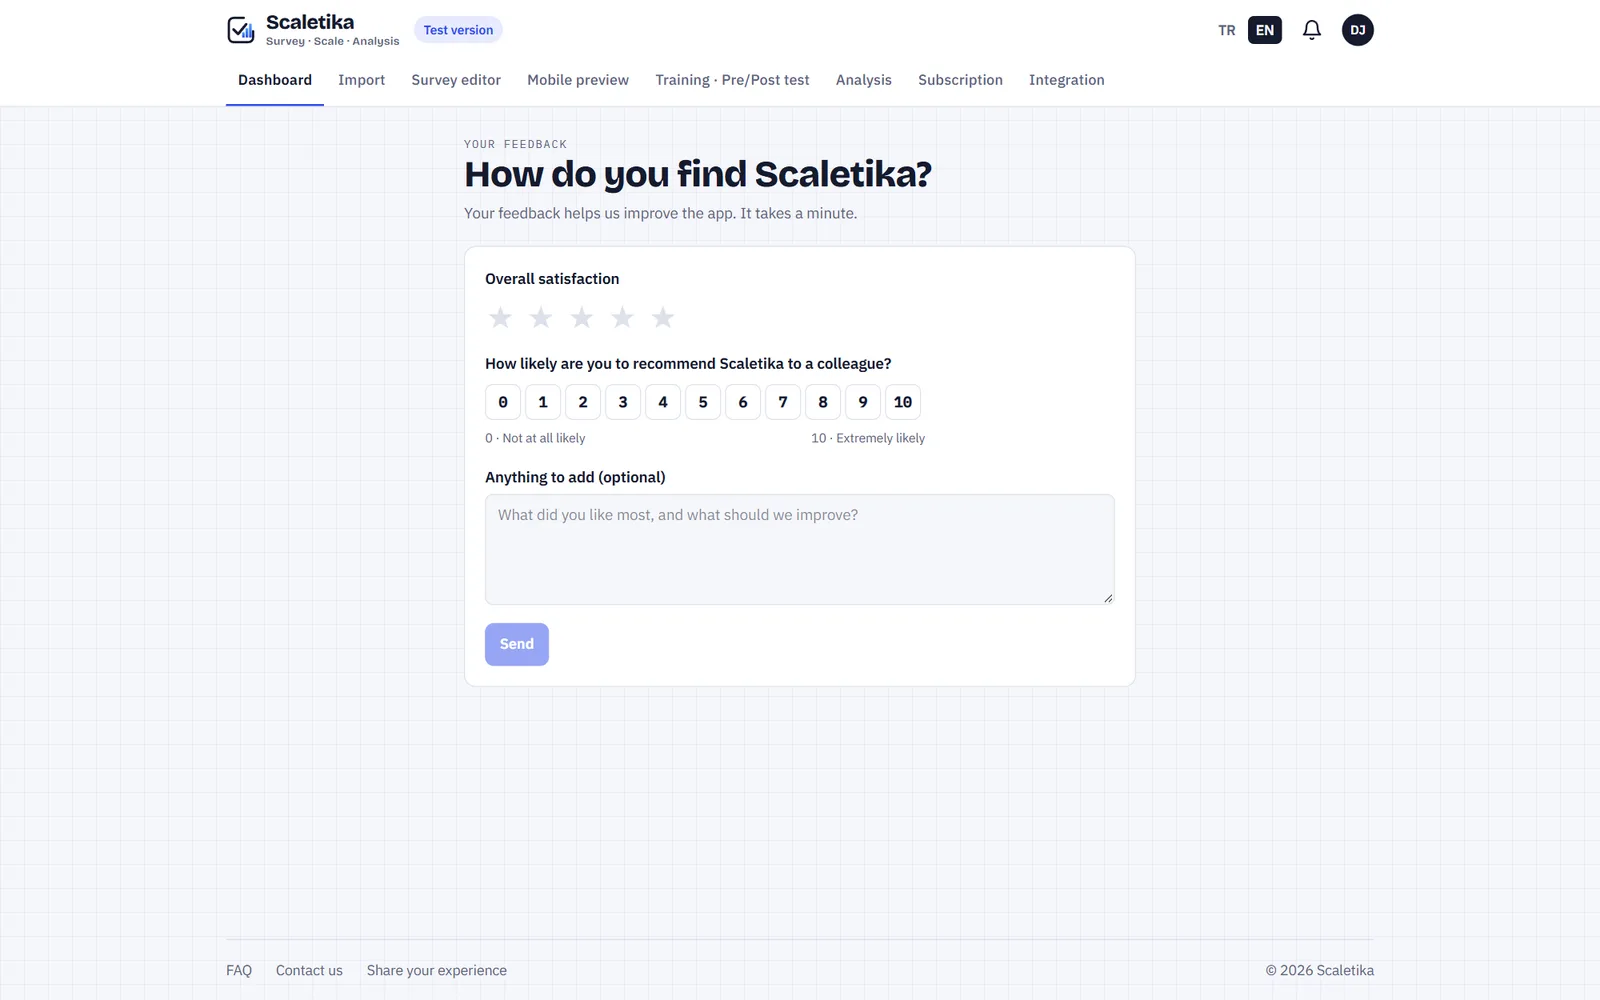
Your initials at top right open the account menu: profile and password, subscription, feedback, contact us, sign out. At the bottom of every screen: FAQ, Contact us, Share your experience.
Using it well
- When sharing your experience you can allow it on the website; it appears in Experiences after our team approves it.
- A few days before the trial ends, a short satisfaction question appears on the Dashboard.
Six rules for effective use
Preview first
Questions lock once you start; test on a phone one last time.
Add a check item
One attention item catches careless answers.
Mark reverse items
In Scale details, or reliability comes out wrong.
Use personal links
The most reliable way for pre/post and key studies.
Read, then exclude
Don’t drop red responses without checking why.
Finish the paragraph
Add your sampling details to the method paragraph.
Take a photo of your first scale.
The rest is five steps: import, edit, share, check, analyze.